Performance Optimization
This guide explains how to optimize KawaiiPhysics performance.
Performance Characteristics
KawaiiPhysics is lighter than typical physics simulations because it doesn't use PhysX.
Processing Cost Factors
| Factor | Impact |
|---|---|
| Bone count | High |
| Collision count | Medium-High |
| Node count | Medium |
| Curve usage | Low |
Optimization Techniques
1. Reduce Bone Count
Only make the minimum necessary bones physics targets.
Skeleton hierarchy:
hair_root → hair_01 → hair_02 → hair_03 → hair_04 → hair_05
All descendant bones under Root Bone are included in the simulation. You cannot skip intermediate bones and simulate only bones farther down the hierarchy. For example, to simulate hair_02 and its descendants, set Root Bone to hair_02. A bone specified in Exclude Bones and all of its descendants are excluded, so use it when you want to exclude an entire branch.
Using Additional RootBones
Since v1.17.0, a single AnimNode can control multiple RootBones.
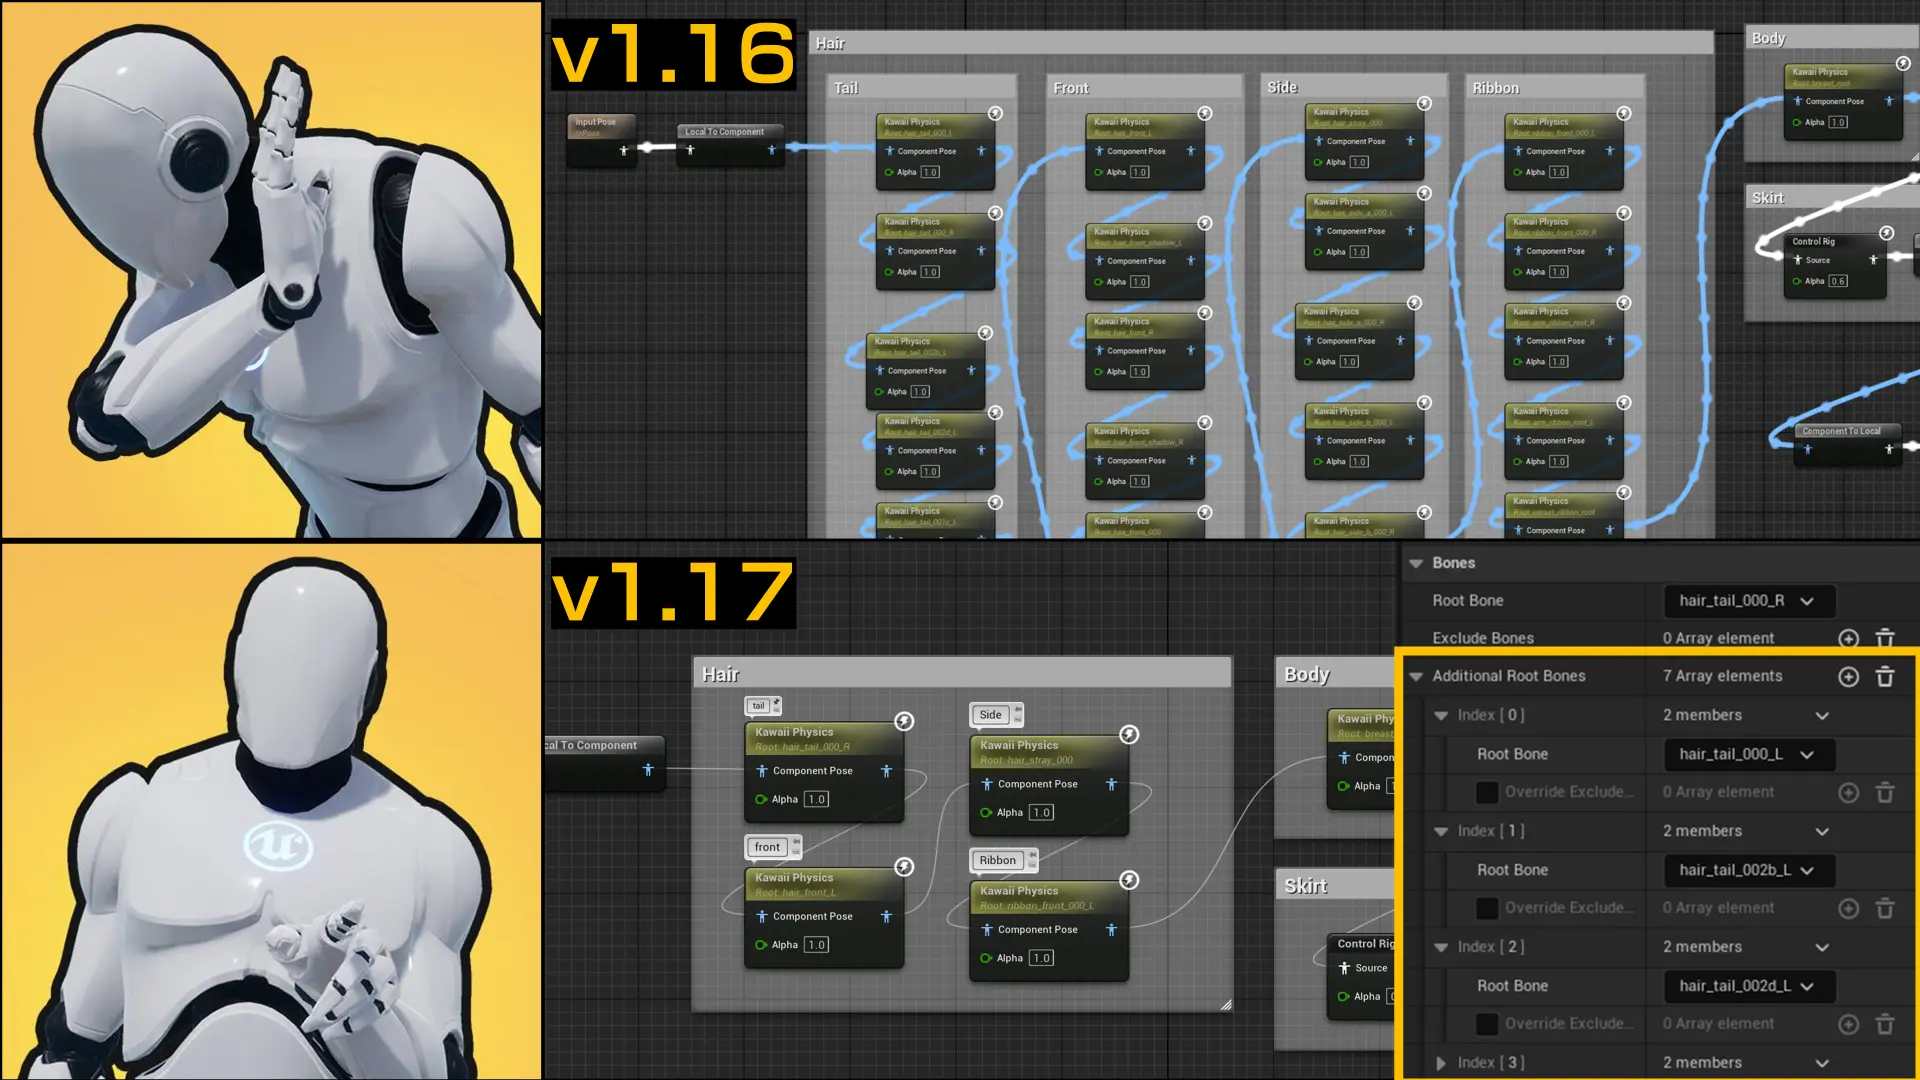
Control multiple bone chains with a single node
Using AdditionalRootBones instead of multiple KawaiiPhysics nodes can reduce the number of nodes.
2. Optimize Collision
- Use simple shapes
- Remove overlapping collisions
- Adjust collision count based on LOD
3. Disable Based on LOD
The node inherits LODThreshold from FAnimNode_SkeletalControlBase (displayed as LOD Threshold in Details), which sets the highest LOD at which the node is evaluated. The node is evaluated up to and including the threshold, and is skipped at higher LODs.
Example: enabled at LOD 0 and LOD 1, skipped at LOD 2 and above
Select the KawaiiPhysics node in the AnimGraph and set LOD Threshold to 1 in Details
4. Adjust Tick Rate
Reducing update frequency can reduce load.
5. Using Warm Up Feature
The Warm Up feature allows you to pre-stabilize physics simulation when spawning characters.
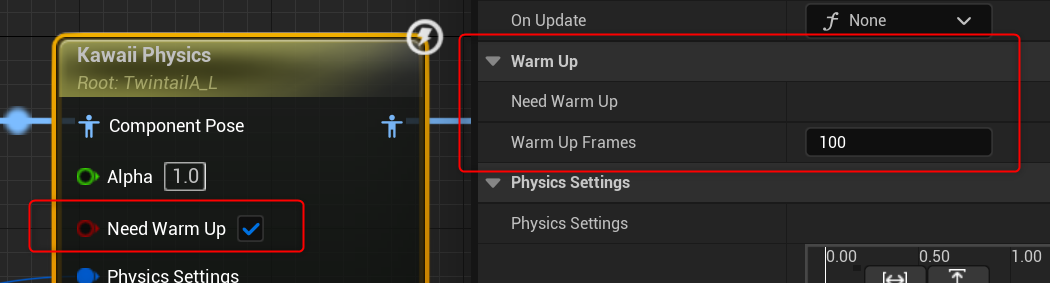
Configuration:
- Set Need Warm Up to
true - Specify the number of warm-up frames in Warm Up Frame (1 or more)
Larger Warm Up Frame values lead to more stability but increase initialization load. Usually 10-30 frames is sufficient.
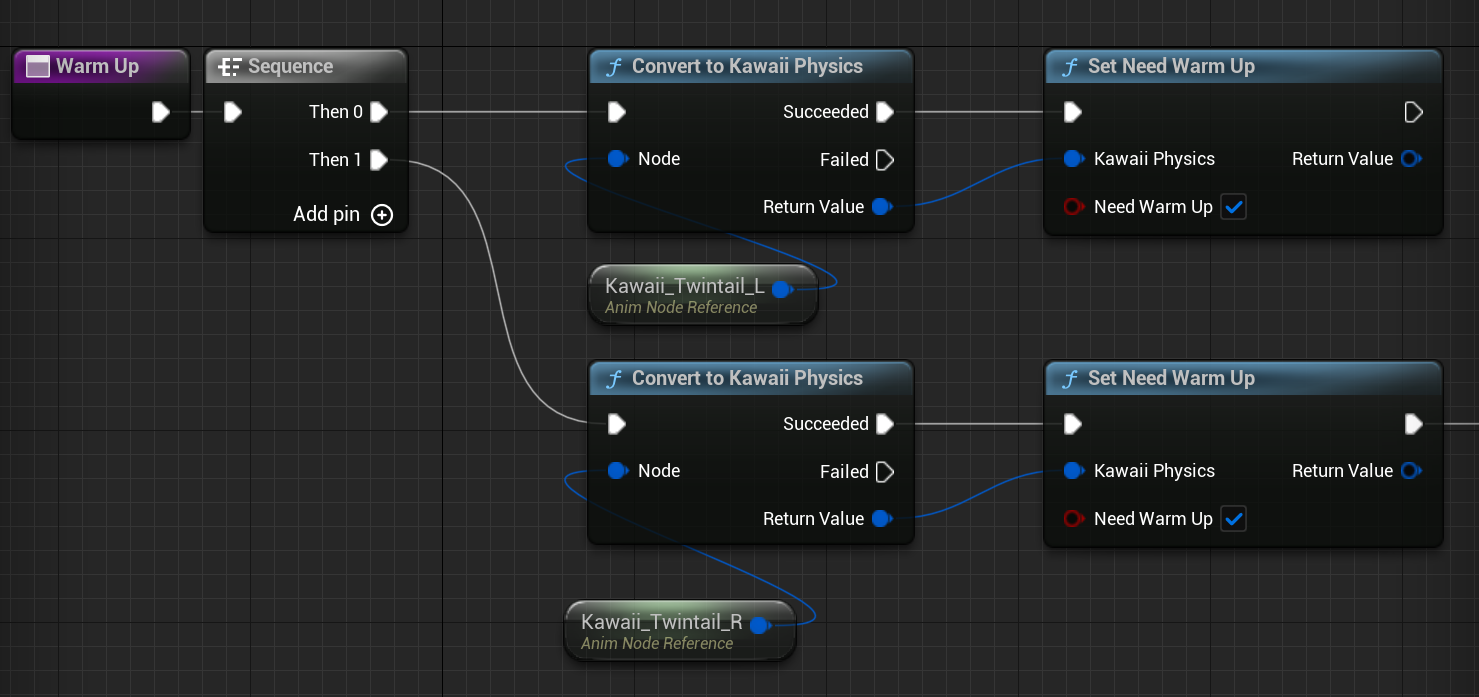
Warm Up can also be dynamically enabled via AnimNode functions. See Changelog v1.13.0 for details.
Profiling
Checking with stat Anim
Run stat Anim in the game or PIE console and look for the KawaiiPhysics_ stats displayed on screen. This is the runtime statistics overlay.
Checking with Unreal Insights
- Start a trace from the Trace / Insights status bar at the bottom of the editor.
- Reproduce the scenario you want to measure, then open the recorded trace in Unreal Insights Session Browser.
- In Timing Insights, inspect the CPU track for animation processing time.
Unreal Insights records and analyzes traces. Its workflow is separate from the stat Anim overlay.
Debugging with Console Variables
Added in v1.16.0
Console variables are available for debugging in the level.
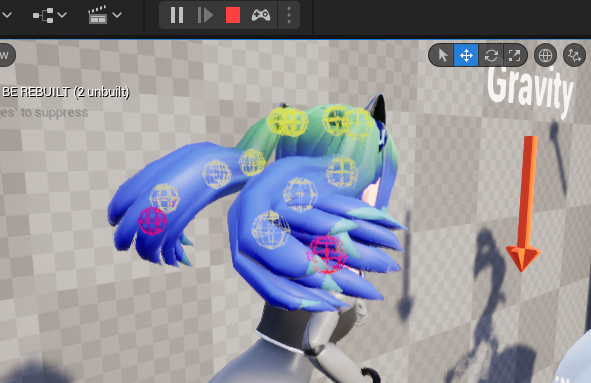
Debugging with console variables
a.AnimNode.KawaiiPhysics.Enable- Toggle enabled/disableda.AnimNode.KawaiiPhysics.Debug- Debug displaya.AnimNode.KawaiiPhysics.DebugDrawThickness- Debug draw line thickness
For the full CVar list, see Console Commands / Variables.
Identifying Bottlenecks
- Many bones → Reduce bones
- Heavy collision calculation → Simplify collision
- Many characters → Use LOD
Processing time varies with the CPU, build configuration, character count, bone count, collisions, LOD, and substepping settings. Avoid treating timings measured under unspecified conditions as benchmarks; profile the target build in its intended runtime environment.